The USC Dornsife Daybreak poll of voters, conducted Aug. 11 — Aug. 29, shows Biden leading Trump 52% – 41% with just 7% undecided. Biden has a strong 13-point lead in the suburbs and is tied with Trump among the subgroup of white suburbanites.
Contact: Jim Key, (619) 253-1077 or jameskey@dornsife.usc.edu or Jenesse Miller, (213) 810-8554 or jenessem@usc.edu
The new USC Dornsife Daybreak poll shows troubling signs for the candidacy of President Donald Trump and not just because he’s trailing his opponent by 11 points, 52% — 41%. The president has lost ground in many core demographic groups who voted for him in 2016, including men, people without college degrees and notably among people in many geographical areas, from small cities to rural agricultural regions.
“Obviously it’s still early and we don’t know the full impact and future course of the ongoing racial strife and the two nominees’ reactions to it, but one thing is clear: Trump starts the fall campaign in a weaker position than any incumbent since George H. W. Bush,” said Robert Shrum, Director of the USC Dornsife Center for the Political Future.
The national probability poll, conducted online Aug. 11 — Aug. 29 by the USC Dornsife Center for Economic and Social Research (CESR) among participants of its Understanding America Study panel, has a margin of sampling error of +/- 1 percentage point. For this analysis, the researchers looked at the data two ways: among all participants since the start of the poll, and by week; examining the period before the Democratic convention, during and after that convention, and during and after the Republican convention. Tracking poll graphic results are updated daily at https://election.usc.edu
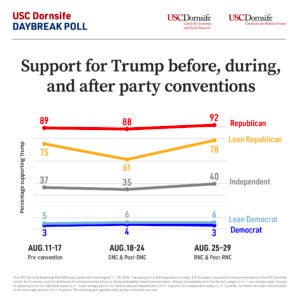
Convention bounces: not much
Overall the two conventions were nearly a wash in terms of the two candidates’ standing among voters nationally, but Donald Trump seemingly succeeded in gaining some ground among undecided or swing voters.
Biden’s pre-Democratic National Convention (DNC) lead of 10 percentage points overall had widened to 14 points by the time the Republican National Convention (RNC) began. That included a 10-point increase in support among Independent voters who lean Republican and a 14-point drop, to 61%, for Trump. But by the end of the RNC, Trump had gained back the lost ground among Republican-leaning Independents to lead Biden 78% – 12%.
During and after the conventions, support for the two candidates changed little or not at all for Independent voters who do not lean toward either major party. These “true” Independents split their vote between the two major candidates with about three in 10 supporting a third-party candidate or remaining undecided.
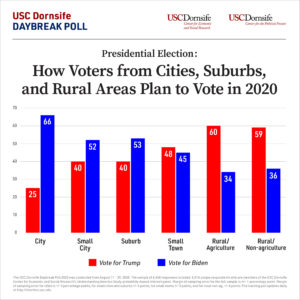
Voter support by geographic region
Notably, in 2016, Democratic candidate Hillary Clinton and Trump were roughly even among suburban voters. This latest Daybreak Poll shows Trump is down 13 points against Biden among self-described suburbanites, 53% – 40%. Among white voters in suburban areas, a group that Trump handily won in 2016, the president is currently tied with Biden.
Trump dominated with rural voters in 2016 and continues to lead against his Democratic rival in that demographic, but by a much smaller margin than four years ago. In 2016, Trump won voters in self-described rural agricultural areas by 3 to 1 but holds less than a 2-1 lead now, 60% – 34%. The president has also experienced a 9-point drop in his margin of support from rural women, compared to 2016.
Among voters in small towns, a demographic Trump won by 6 points in 2016, he’s currently in a statistical tie with Biden, 48% – 45%, within the margin of sampling error for that location. Voters in big cities back Biden at about the same level as they backed Clinton in 2016.
“The race can tighten as election days nears, but Biden is still in a strong position,” said Mike Murphy, co-director of the USC Dornsife Center for the Political Future. “Trump is underperforming in the groups he needs, particularly suburban voters. And he’s running out of time to change that.”
Trump lags with key demographic groups
The president has lost ground among several other key demographic groups since his 2016 victory.
Trump’s significant lead among men four years ago has turned into a 4-point deficit with Biden leading, 49% – 45%. Among voters without a college degree, a group Trump won by 10 points in 2016, the two candidates are statistically tied: 47% for Biden and 45% for Trump. And though the president has a 9-point advantage over Biden among white voters, 51% to 42%, that is roughly half the size of his win against Clinton in 2016 in this group.
Trump may also have lost an advantage he had with seniors in 2016. The single digit margin of support he enjoyed in the last election has been replaced by a 6-point lead for Biden among voters 65 and older.
Additional models: Biden lead varies
In addition to the Daybreak Poll’s main probability-based model, it is tracking the presidential race through three additional methodologies. The social circle and state expectations methodologies are conducted in partnership with a team of researchers from the Santa Fe Institute and Massachusetts Institute of Technology.
In this model, voters are asked how they think people in their social circle and state will vote. Biden’s lead shrinks to just 5 points, 50% – 45%, in response to the social circle question and it’s within the margin of error, 47% – 46%, in response to the question about how residents of the state will vote.
“One potential explanation for Biden’s significantly smaller lead resulting from these methodologies is that Democratic voters were surprised by Trump’s victory in 2016 and are particularly nervous about the outcome of this election,” said Jill Darling, polling director for the USC Dornsife Center for Economic and Social Research. “Another possibility is that they’re an indication of growing Biden support among social circles that are more traditionally in the Trump camp. Our colleagues who added these questions have used them to very accurately predict outcomes in previous races in the U.S. and in Europe and we’re interested to see how they perform in this very unusual election year.”
In the categorical model, voters are simply asked for whom they would vote if the election was held today. This model registers a 14-point advantage for Biden, 51% – 39%, with 9% of voters undecided and 2% supporting other candidates. Libertarian candidate Jo Jorgensen and Green candidate Howie Hawkins garnered less than 1% of the vote between them.
About the USC Dornsife Daybreak Poll
The USC Dornsife Daybreak Poll 2020 was conducted from August 11 to August 29, 2020. On August 11, 8,355 members of the Understanding America Study probability-based internet panel were invited to participate. At the time of this analysis, 6,601 eligible voters had completed the intake survey and 6,346 (96%) agreed to participate every other week on an assigned day.
This analysis is based on a sample of 6,240 responses over two waves of data collection, including the latest responses among 5,016 unique respondents. The larger sample was weighted by participation week for analysis of change over time, and the sample of unique respondents was separately weighted for all other estimates.
Overall margin of sampling error for the full sample is +/- 1 percentage point. Margin of sampling error for individual weeks is +/- 3 percentage points; for Democrats and Republicans it is +/-2 points; for independent voters is +/- 4 points; for those who lean toward either of the two major parties it is +/-6 points and for Trump and Clinton voters in 2016 it is +/-2 points. Margin of sampling error for other subgroups may vary, and are provided in the associated methodology and topline document.
The survey is conducted by the USC Dornsife Center for Economic and Social Research (CESR), in partnership with the USC Dornsife Center for the Political Future. It is funded in part by USC Dornsife with additional funding from research grants. The tracking poll is updated daily at election.usc.edu.
Press releases, graphics, toplines and other documents are available from the Center for the Political Future and from CESR’s elections data page which also provides access to data, and additional surveys and information.
###